
The Short Answer
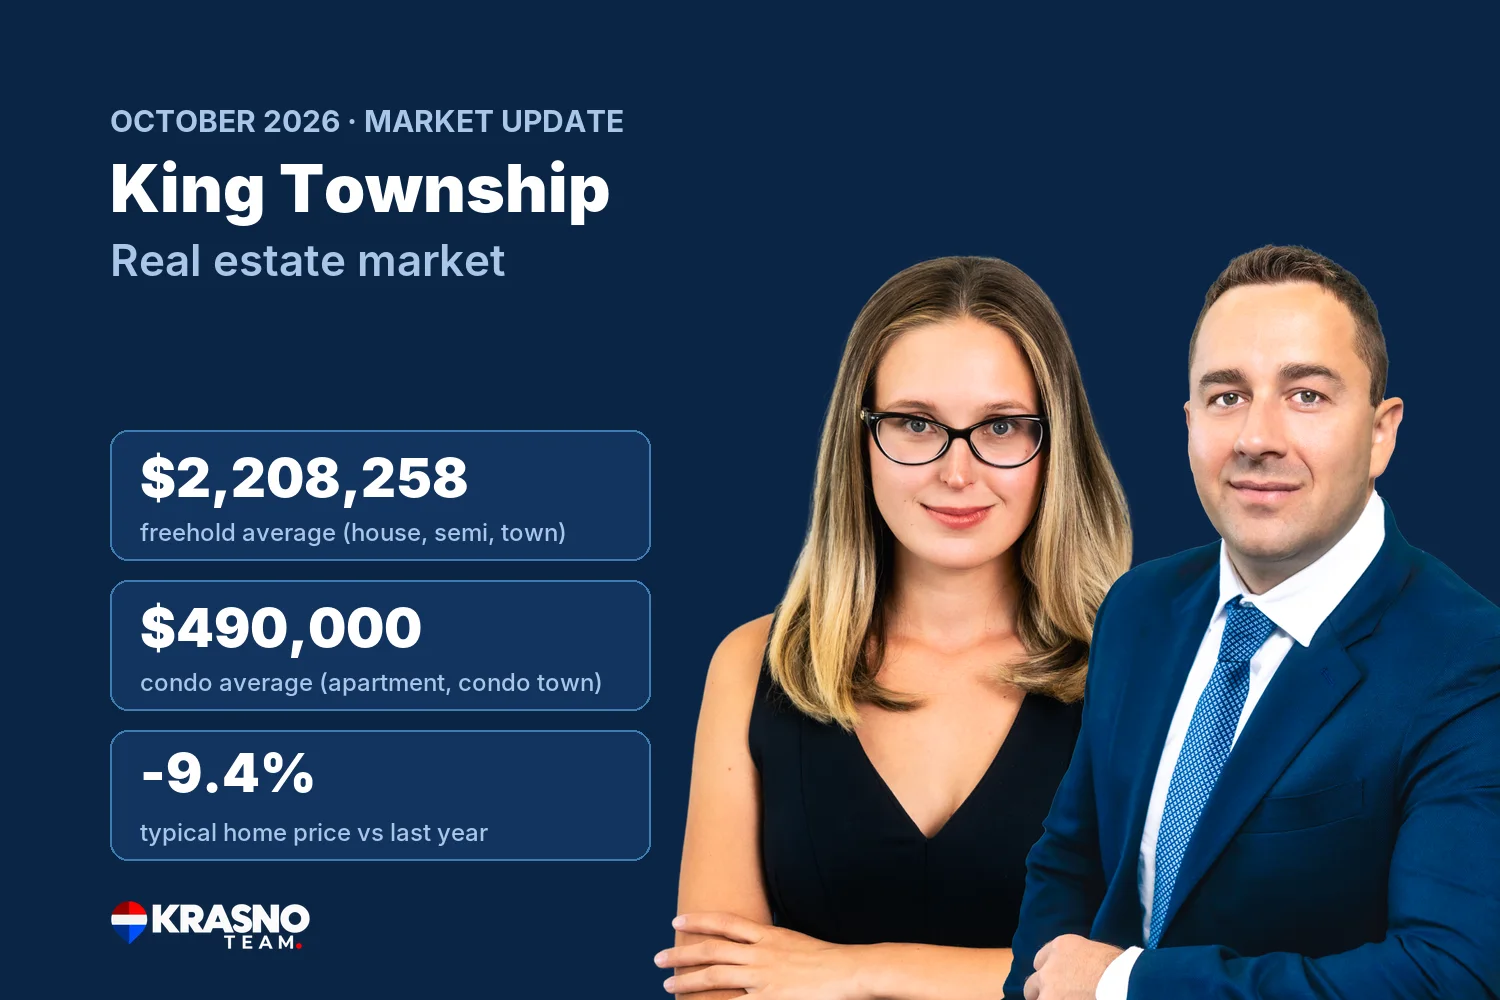
As of October 2026, freehold homes (houses, semis and townhouses) in King Township sold for $2,208,258 on average and condos for $490,000 (TRREB). The price of a typical home was down 9.4% from a year earlier, and buyers have the edge.
This is our King Township real estate market update for October 2026: home prices, sales, listings and what the numbers mean if you're buying or selling a home in King Township, Ontario. We refresh it every month when TRREB releases new numbers.
1King Township Market at a Glance: October 2026
Here are the main numbers for King Township, Ontario in October 2026, from the Toronto Regional Real Estate Board (TRREB).
Houses and condos sell at very different prices, so we show them separately. A month with lots of condo sales pulls the all-homes average down even when house prices haven't moved.
| Homes sold | Average price | |
|---|---|---|
| Freehold (detached, semi-detached, townhouse) | 22 | $2,208,258 |
| Condo (apartment, condo townhouse) | 6 | $490,000 |
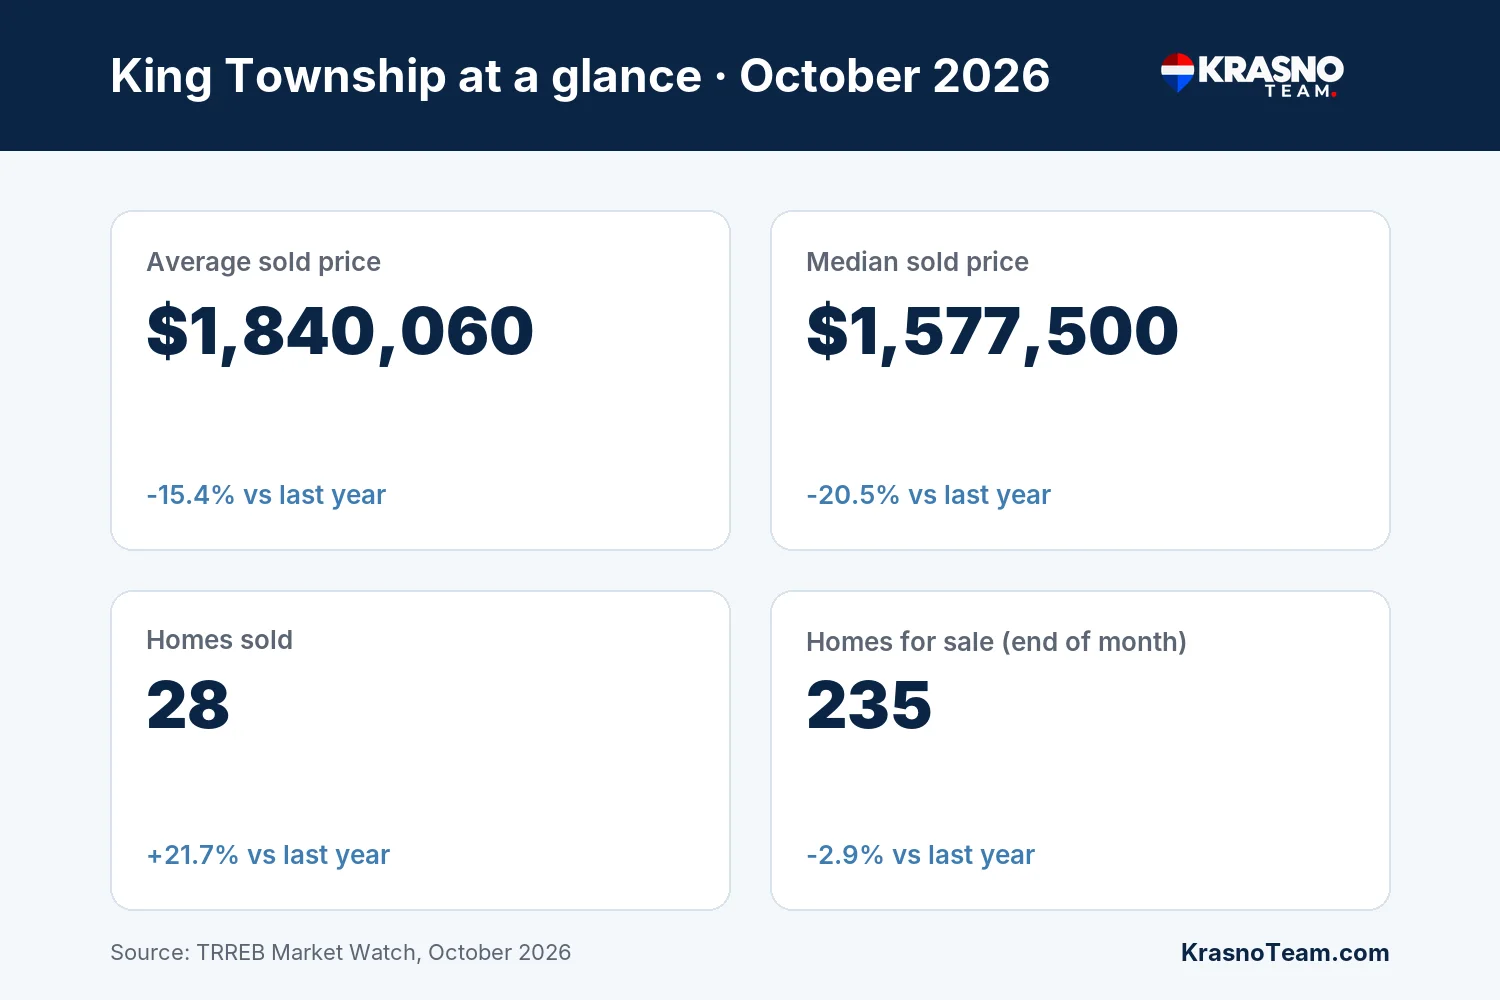
| All home types | 28 | $1,840,060 |
| October 2026 | October 2025 | Change | |
|---|---|---|---|
| Homes sold | 28 | 23 | +21.7% |
| Average sold price | $1,840,060 | $2,175,043 | -15.4% |
| Median sold price | $1,577,500 | $1,985,000 | -20.5% |
| New listings | 110 | 91 | +20.9% |
| Homes for sale (end of month) | 235 | 242 | -2.9% |
| Average days on market | 59 | 25 | +34 days |
| Sold price vs asking price | 92% | 94% | -2 pts |
28 homes sold in King Township in October 2026, up 21.7% from October 2025. The average sold price was $1,840,060, down 15.4% from a year earlier.
With only 28 sales, the average can move a lot from one month to the next. The benchmark price below, down 9.4% year over year, is a steadier guide to where prices are heading.
The average can jump around when a few very expensive or very cheap homes sell. The median, the middle price, is often a better guide to a typical home.
2King Township Home Prices by Property Type
Prices in King Township depend a lot on the type of home. Here is what each type sold for in October 2026.
| Home type | Homes sold | Average price | Median price | Avg. days on market |
|---|---|---|---|---|
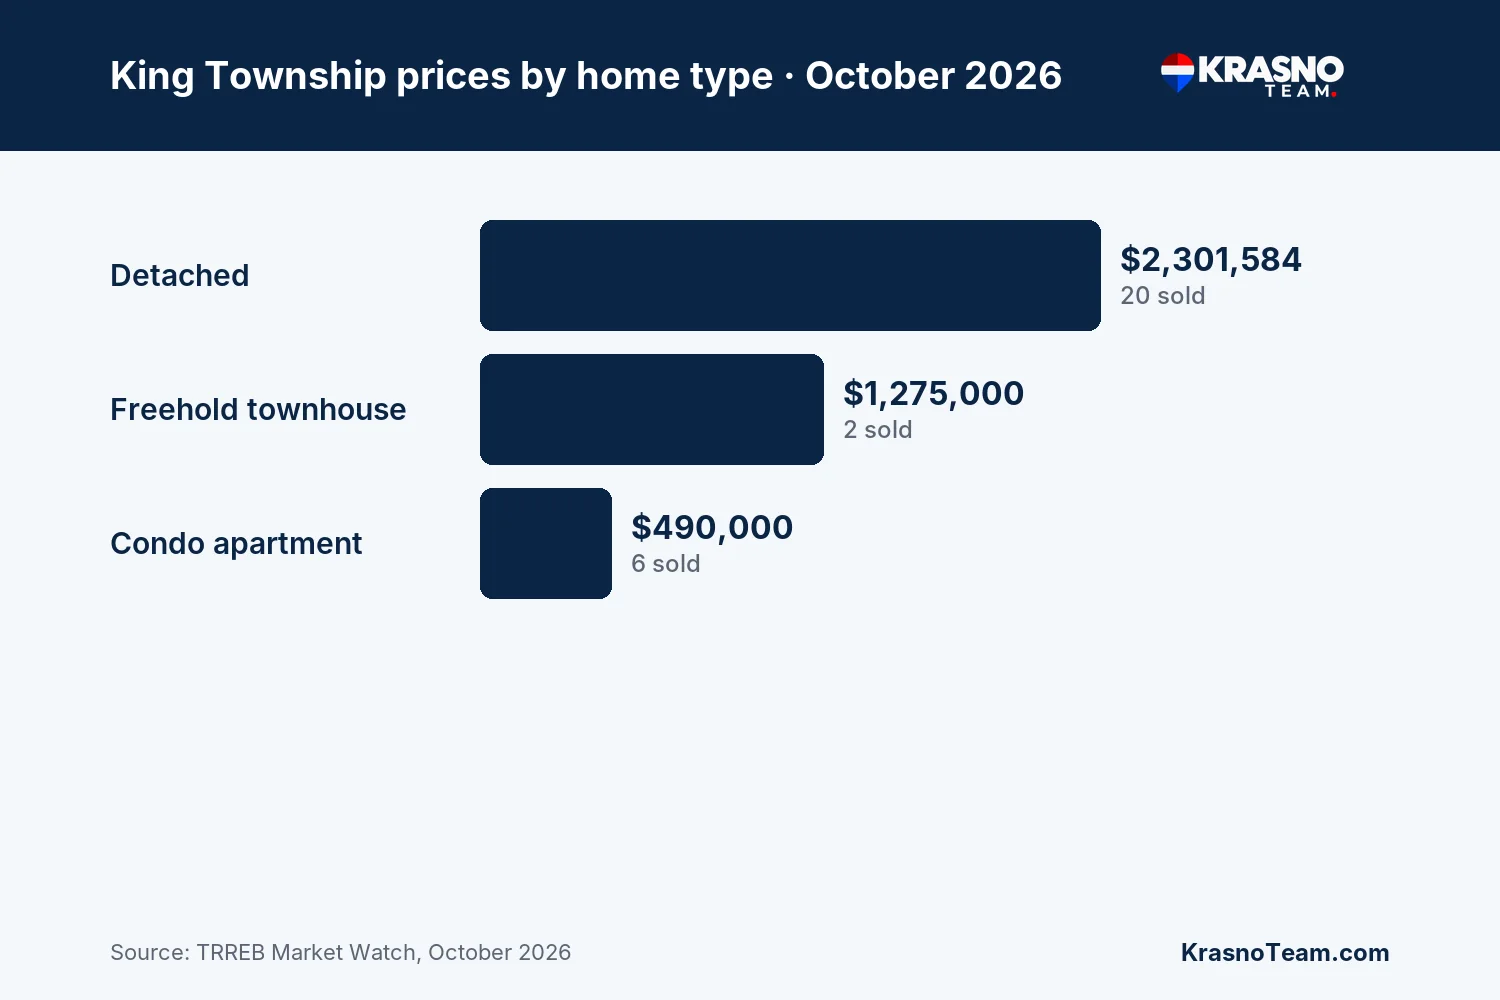
| Detached | 20 | $2,301,584 | $1,827,500 | 37 |
| Freehold townhouse | 2 | $1,275,000 | $1,275,000 | 19 |
| Condo apartment | 6 | $490,000 | $482,500 | 147 |
Only a few homes sold in some types this month (freehold townhouse and condo apartment), so those averages can swing a lot from month to month.
3Is King Township a Buyer's or Seller's Market Right Now?
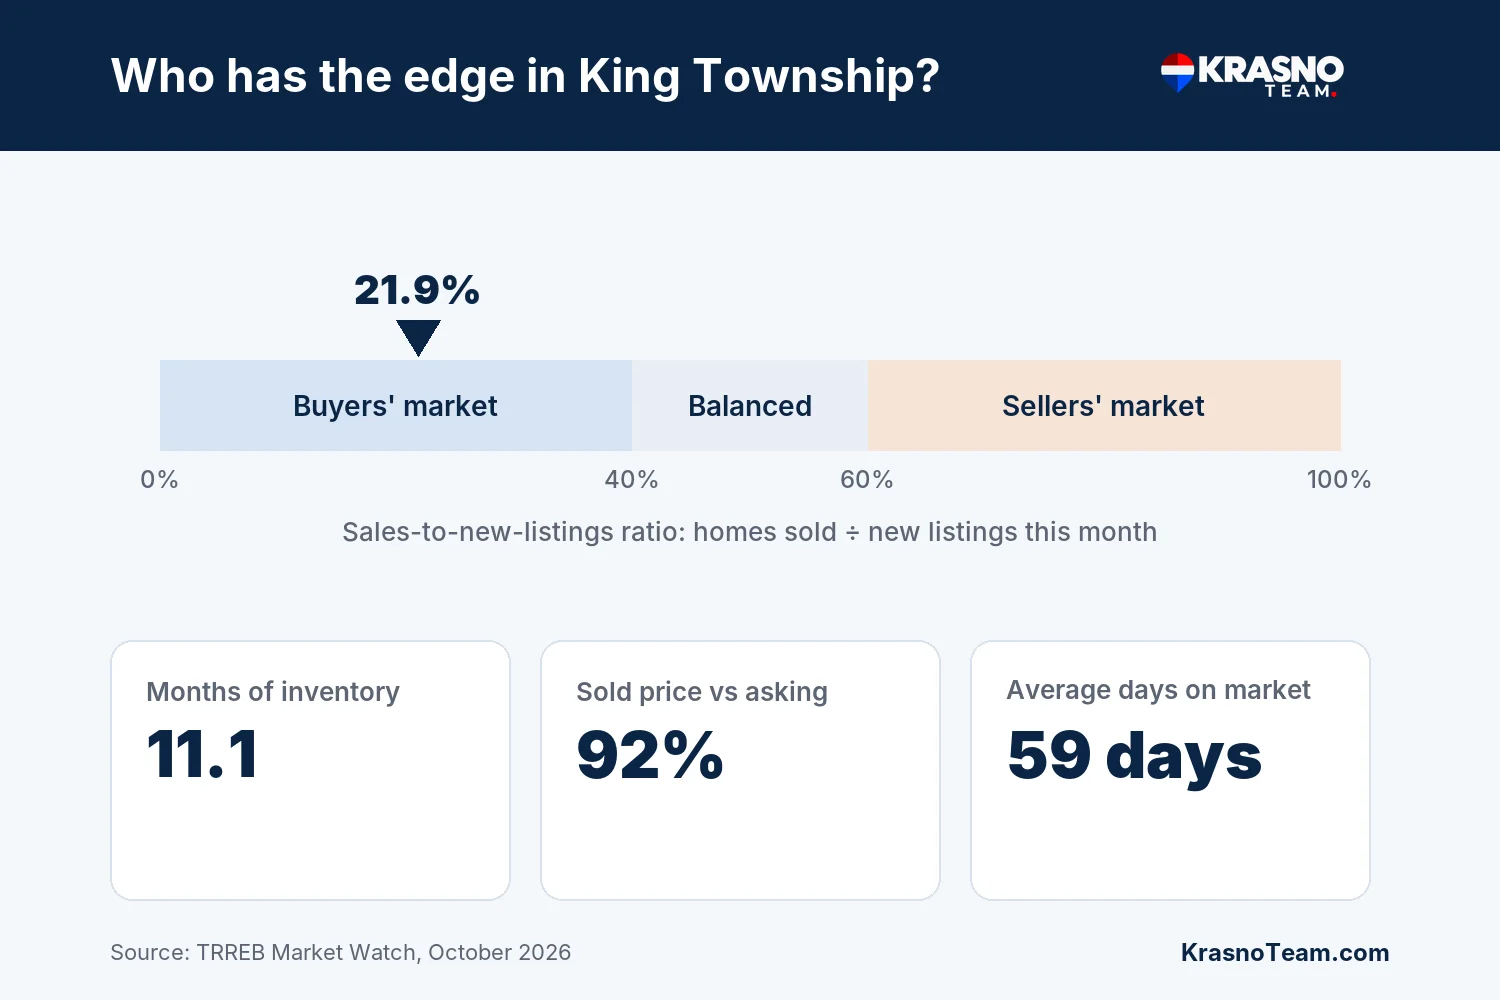
As of October 2026, King Township is a buyers' market. Buyers have the edge.
- Sales-to-new-listings ratio: 21.9%. Under 40% usually means a buyers' market, 40% to 60% is balanced and over 60% favours sellers (CREA's common rule of thumb).
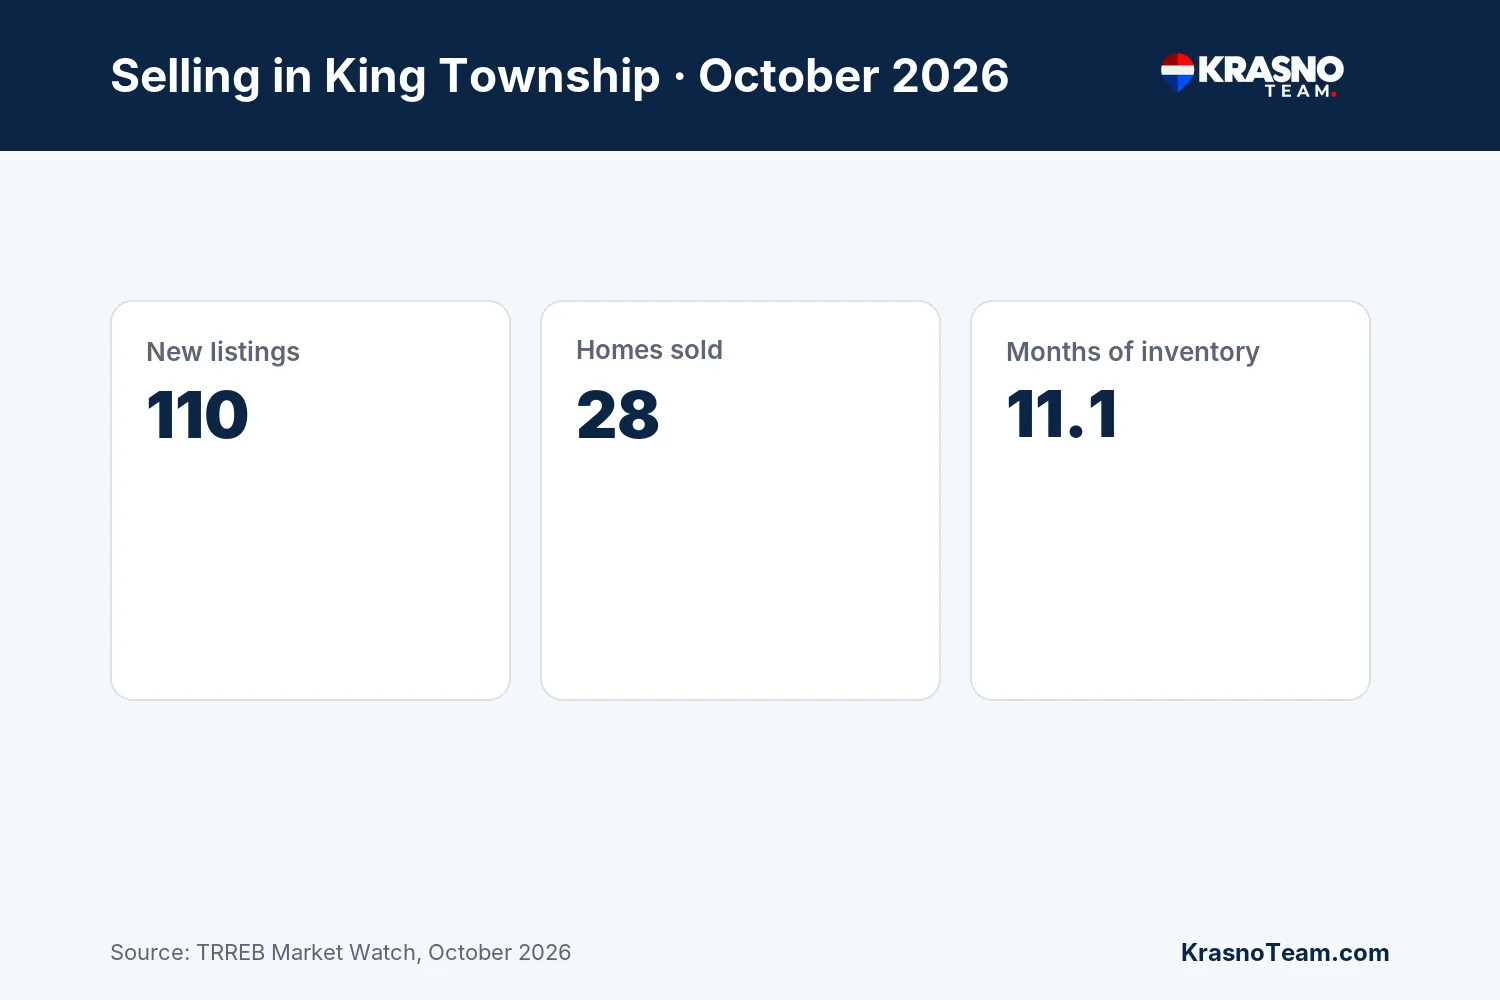
- Months of inventory: 11.1. This is how many months it would take to sell every home for sale at the current pace.
- Sold price vs asking: 92%. On average, homes sold for 92% of their asking price.
- Days on market: 59 days on average for the listing that sold.
4King Township Benchmark Prices vs Last Year
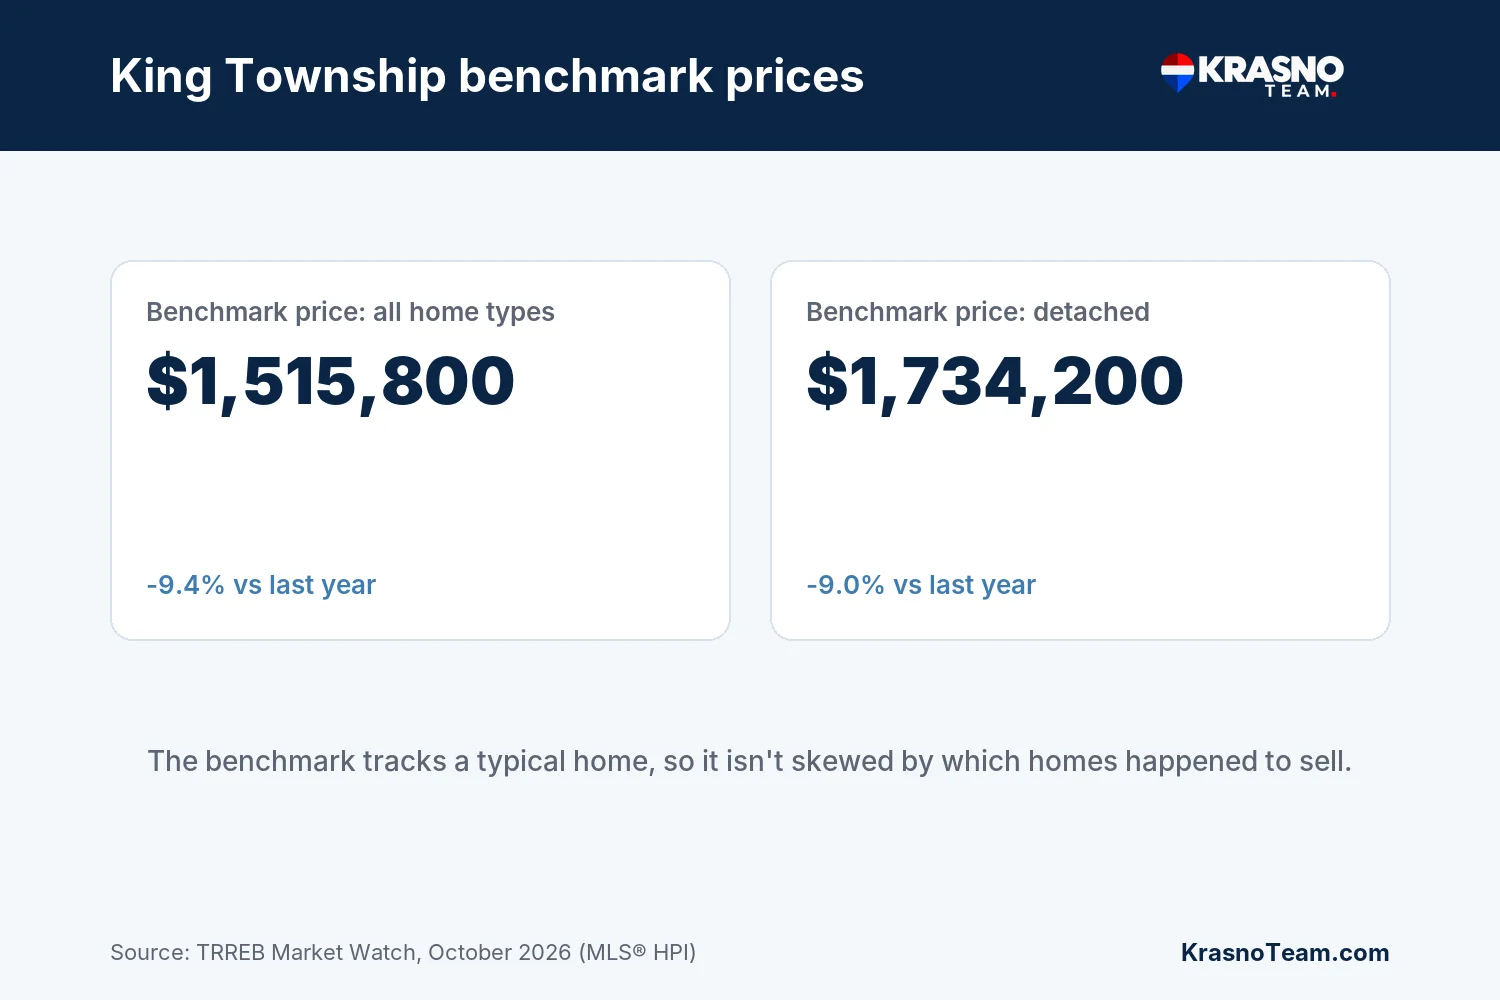
The MLS® Home Price Index tracks the price of a typical home, so it isn't thrown off by which homes happened to sell that month.
As of October 2026, the benchmark price for all home types in King Township was $1,515,800, down 9.4% from a year earlier. The benchmark price for a detached home was $1,734,200, down 9.0% year over year.
5King Township Housing Market So Far in 2026
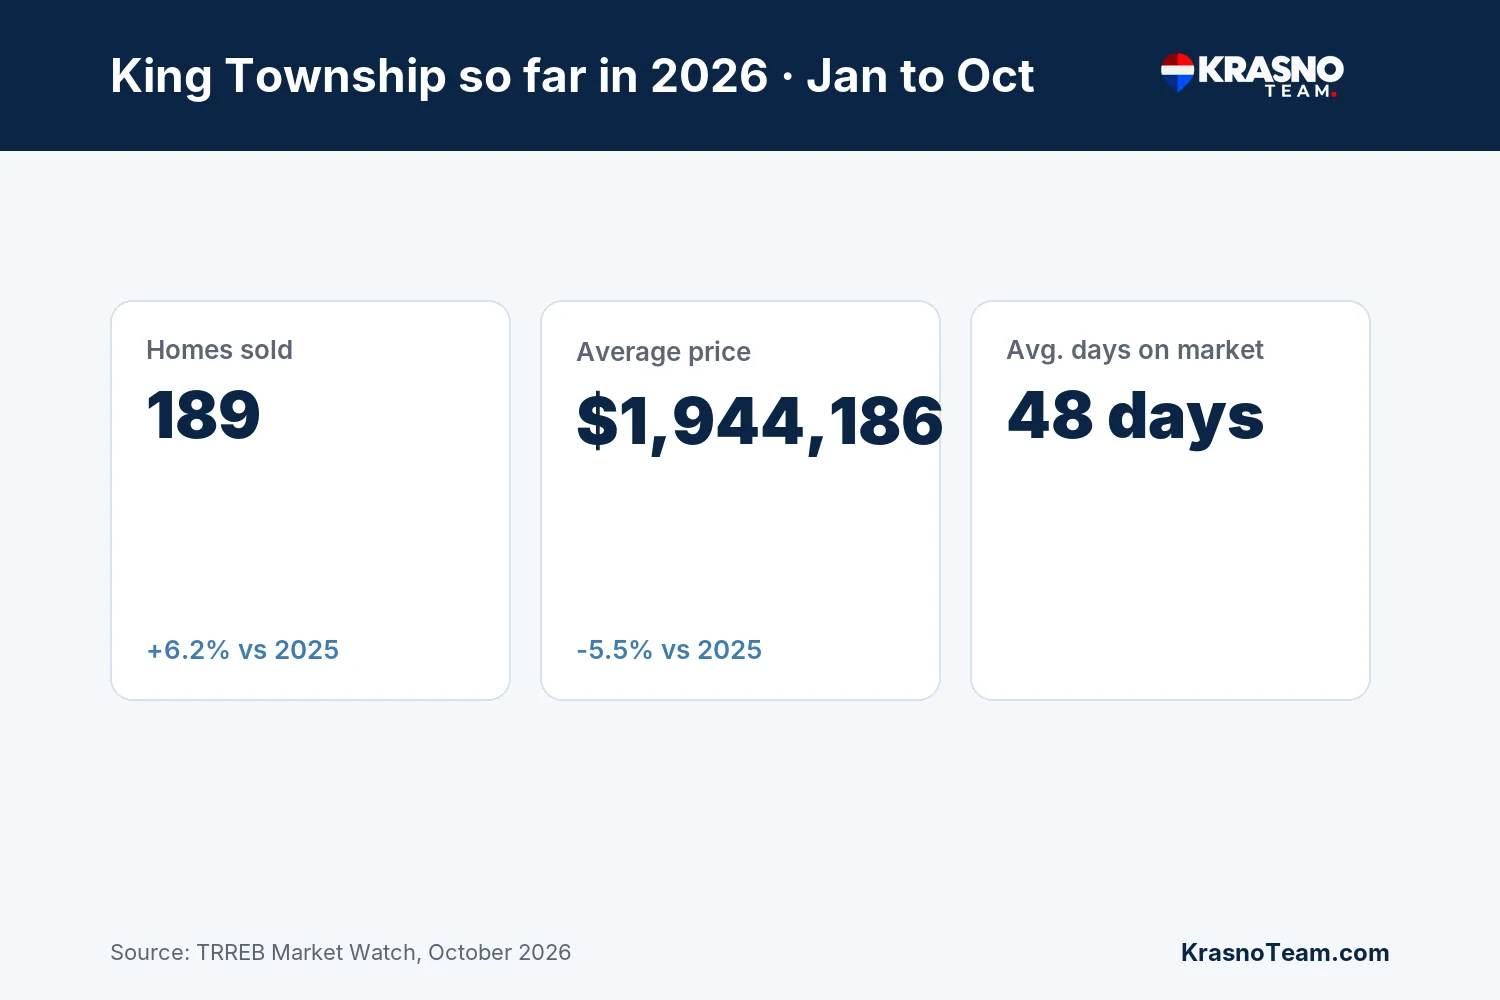
From January to October, here is how 2026 compares with the same months of 2025 in King Township.
| January to October | 2026 | 2025 | Change |
|---|---|---|---|
| Homes sold | 189 | 178 | +6.2% |
| Average sold price | $1,944,186 | $2,057,261 | -5.5% |
| Median sold price | $1,710,000 | $1,809,500 | -5.5% |
| New listings | 931 | 871 | +6.9% |
So far in 2026, 189 homes have sold in King Township at an average price of $1,944,186, down 5.5% from the same period in 2025.
6Buying in King Township This Month
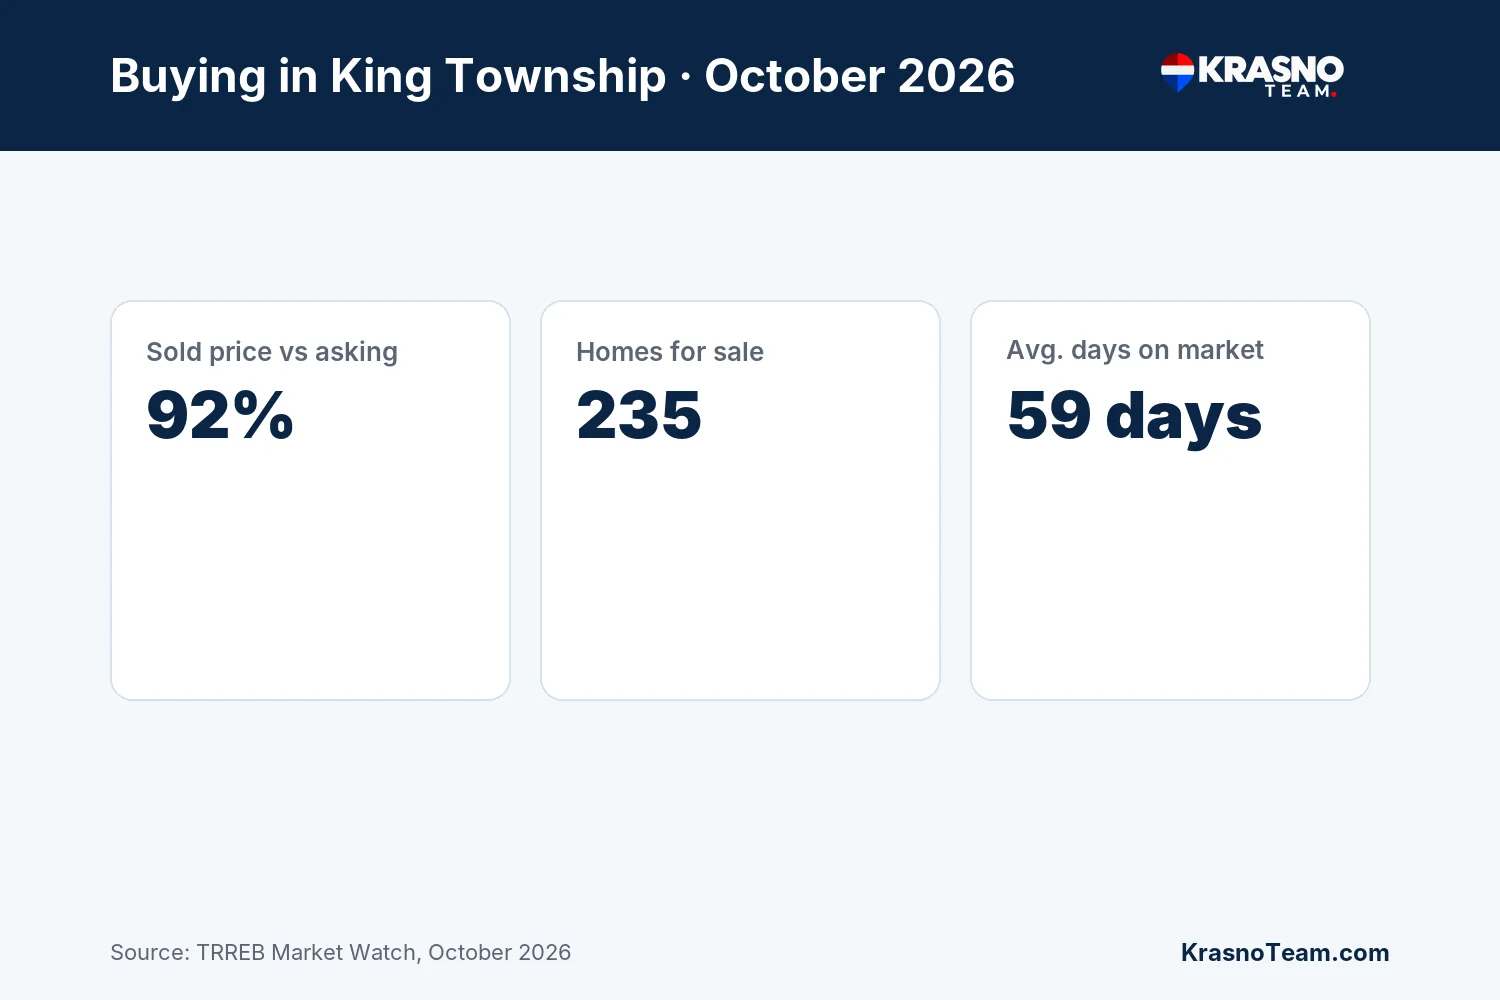
- Room to negotiate: homes sold for 92% of asking on average in October 2026.
- Choice: 235 homes were for sale at the end of the month.
- Time to decide: the average home that sold was on the market for 59 days.
- Prices vs last year: the typical home's benchmark price was down 9.4% from a year earlier.
Every street is different. We pull the recent sales for any home you're serious about before you make an offer.
7Selling in King Township This Month
- Competition: 110 new listings came on the market in October 2026, and 28 homes sold.
- Pricing: homes sold for 92% of asking on average, so pricing right from day one matters.
- Timing: expect around 59 days on market for a home that sells.
Want to know what your King Township home would sell for today? Get a free home value, free with no obligation.
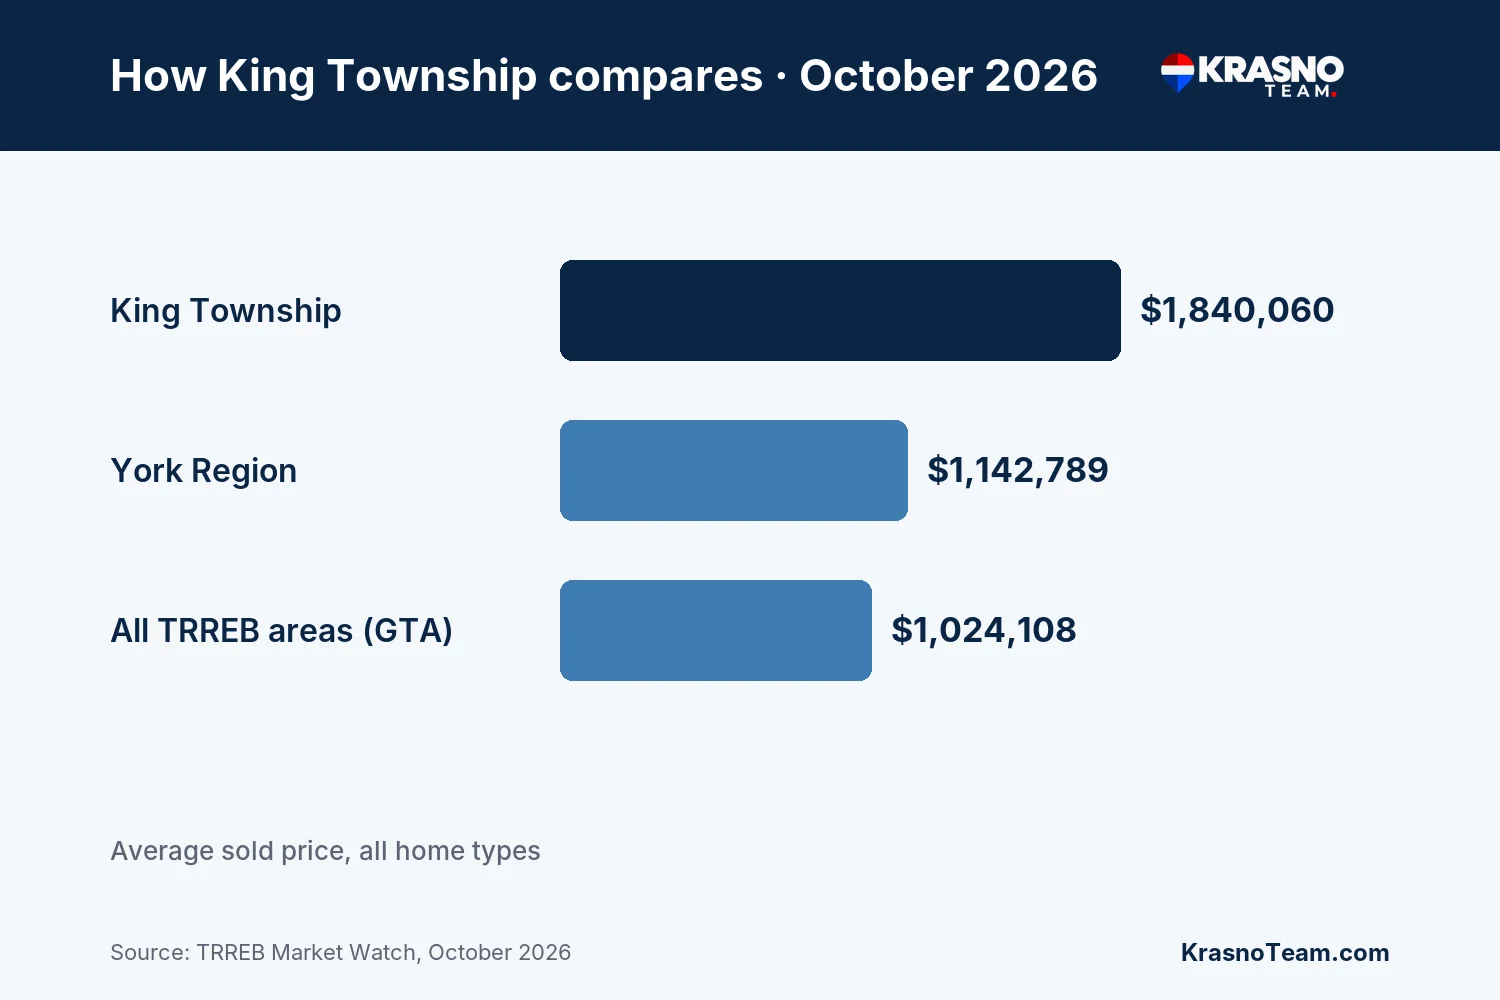
8How King Township Compares
| Area | Average sold price | Homes sold | Sales-to-new-listings |
|---|---|---|---|
| King Township | $1,840,060 | 28 | 21.9% |
| York Region | $1,142,789 | 1,038 | 36.2% |
| All TRREB areas (GTA) | $1,024,108 | 5,603 | 37.9% |
More local numbers: Aurora market update · Vaughan market update · Newmarket market update · King City homes and prices · King Township's 5 areas compared. See every area's market update.
Source: TRREB Market Watch, October 2026. Figures are for all home types unless noted. Updated every month when TRREB releases new numbers.
Know your numbers before you shop.
Financing through Estate Mortgage Group, our affiliated brokerage — so your purchase and your mortgage are handled by one team, start to finish.
Estate Mortgage Group · FSRA Licence #13425. Affiliated with the Krasno Team through common ownership. You are under no obligation to use our affiliated mortgage services.
Thinking about a move to King Township?
Five communities, five very different markets. Tell us what you're looking for and we'll tell you which one actually fits — and what your budget buys in each.
Questions buyers ask
Questions about King Township?
Call or text the Krasno Team at 647-575-2005, or email Anthony@KrasnoTeam.com.
Market Snapshot
Facts are subject to change. Always confirm. See disclaimer
Ask us the specific thing
More King Township guides
Nobleton Homes for Sale - Prices, Market Data & Neighbourhood Guide
As of mid-August 2026, 35 homes have sold in Nobleton with an average sale price of $1,748,737 and a median of $1,767,500. Prices ranged fro…
King Township Real Estate
King Township's residential market divides into five distinct areas: King City, Nobleton, Rural King, Schomberg and Pottageville. In 2026 so…

King City Real Estate
As of mid-August 2026, 27% of King City's 49 MLS® sales closed under $1.4 million — the market is more accessible than most buyers expect. T…


The team behind this guide
We're the Krasno Team — we live and work in these communities, and every guide on this site is the research we run for our own clients.
Anthony Krasno, Realtor® · RE/MAX Realtron Realty Inc., Brokerage
Get King Township listings sent to you
Tell us what you're looking for — we'll send matching listings and price changes as they come up.
Market Snapshot
Facts are subject to change. Always confirm. See disclaimer